Magellan Solution
Web App
Laravel
Visualization

Turning social noise into a clearer picture of brand presence and competition

As a Sr. Product Designer at Nurun, I was brought in to help a marketing partner of Publicis Montréal turn a fragmented analytics experience into something more cohesive. They were already using several third-party tools for social media monitoring and competitive analysis, so the opportunity was to bring those insights together in one place. Working closely with engineers, we built a proof-of-concept prototype to explore how three existing APIs, PI System, Upfluence, and Tableau, could be integrated into a single, unified web platform.
The Problem
Take the grunt work out of competitive analysis and make social insights easier to see, share, and act on.
We set out to create a unified platform that could bring data together from multiple sources, dramatically reduce reporting time, and give the team a shared view of their competitive landscape. Success would mean cutting report generation time by 80%+, driving 90%+ adoption in the first month, and giving the team instant access to shared, up-to-date insights.
Solution
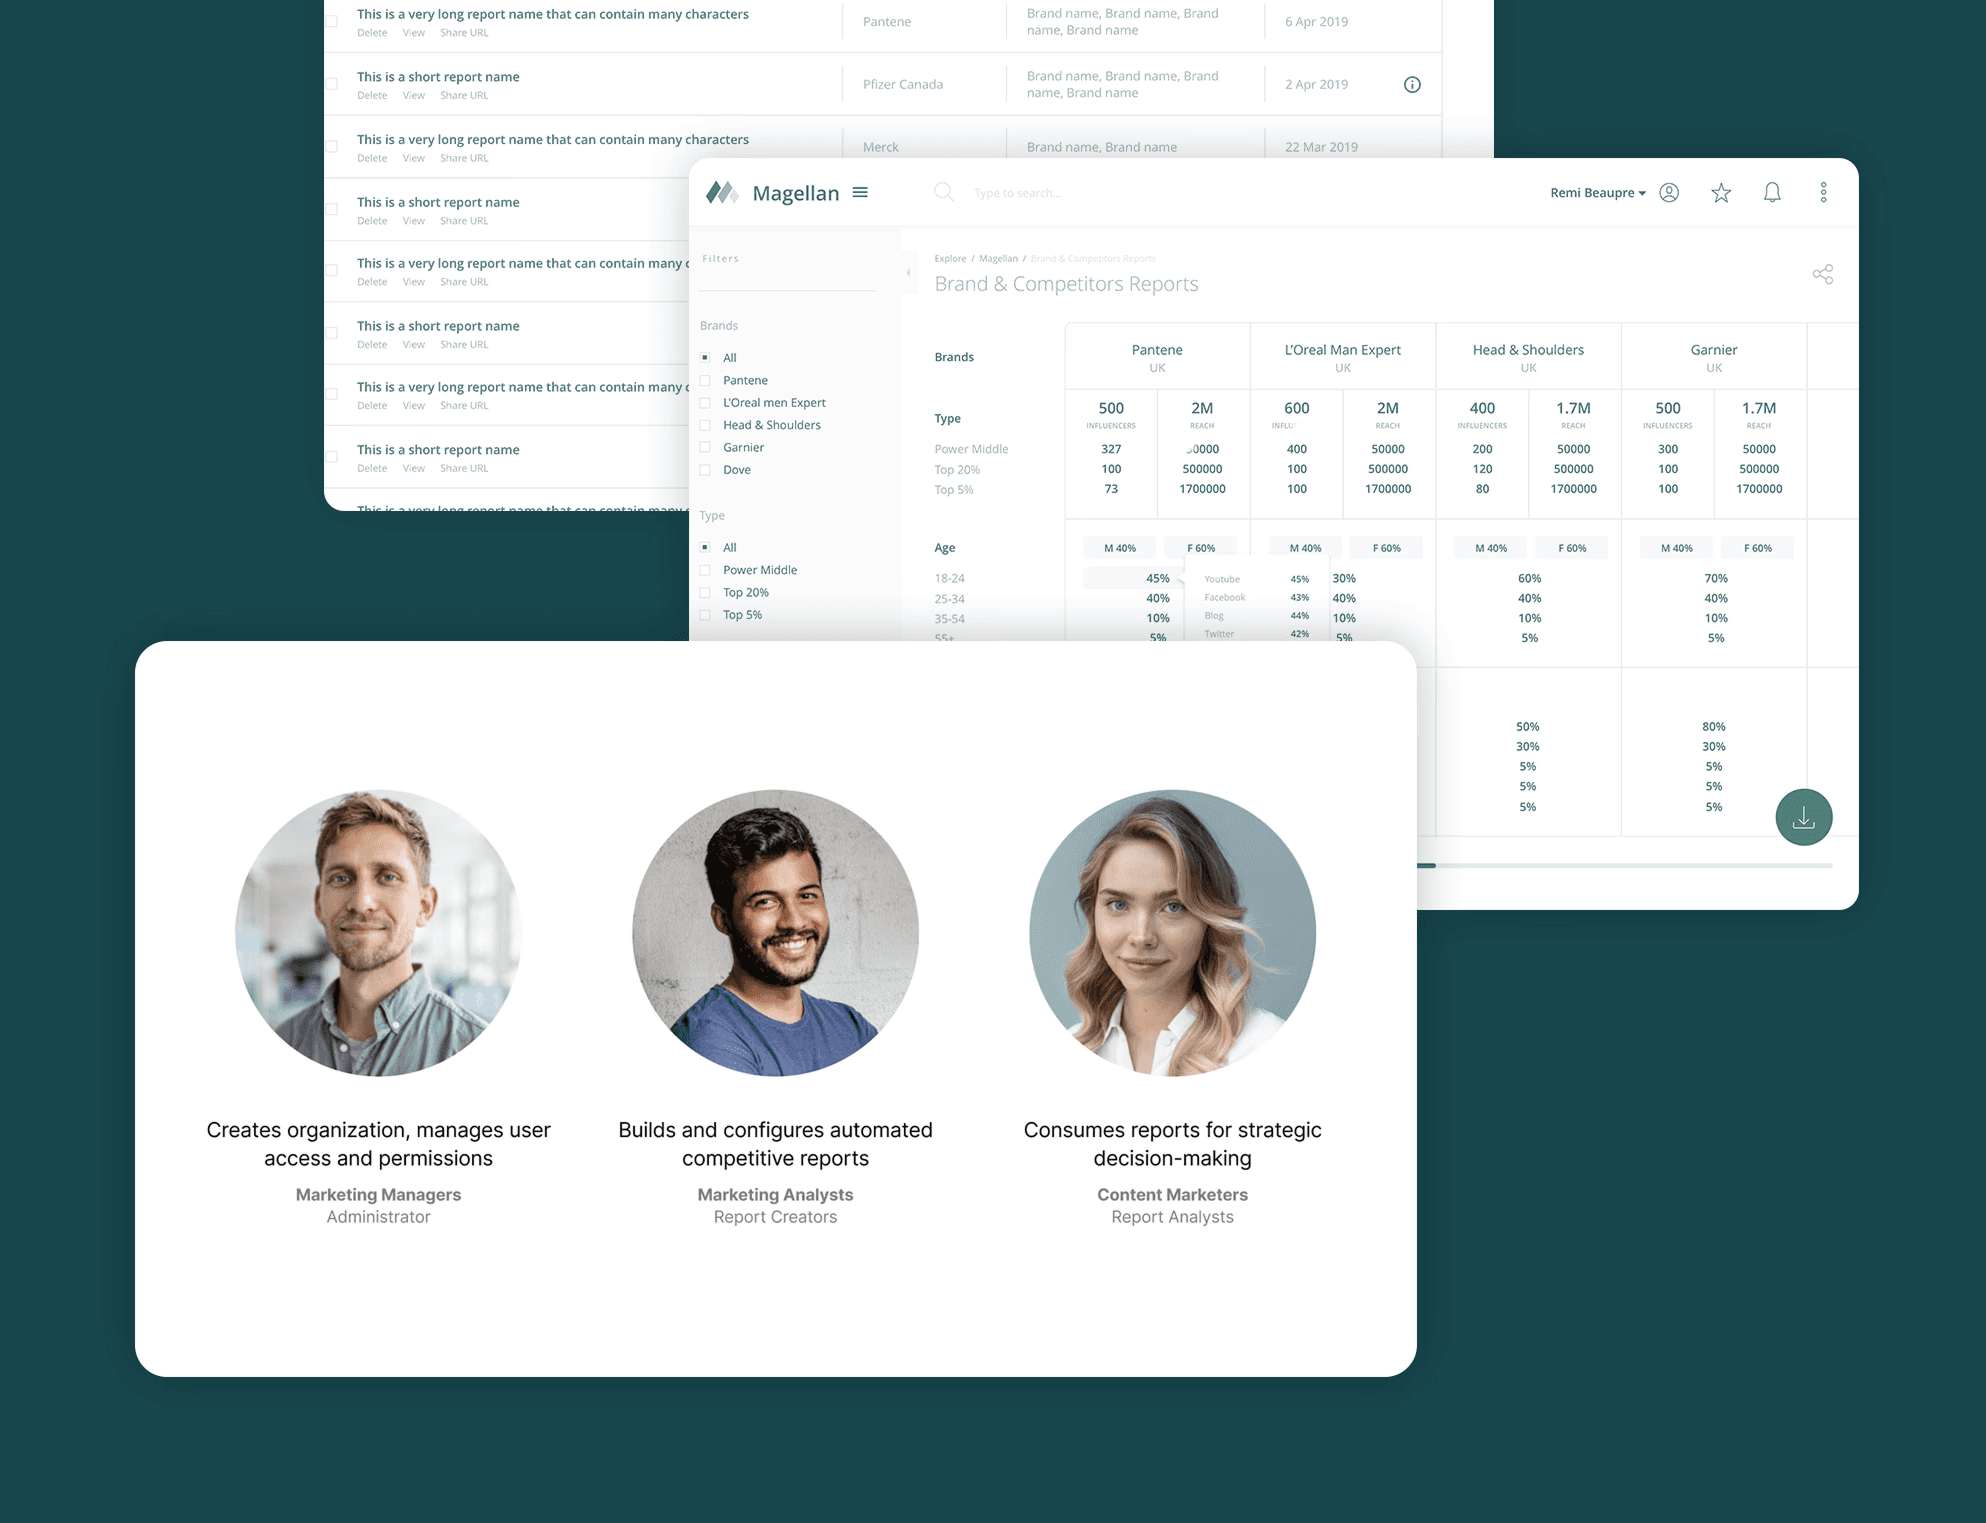
One platform, three ways of working. The platform should adapt to the people using it, not the other way around. I mapped detailed user flows and wireframes around three core roles: marketing managers who organized reports and managed permissions, marketing analysts who built reports and worked with the data, and content marketers who needed fast, easy-to-digest visual insights.
Rather than forcing everyone through the same experience, I designed each workflow around what that role actually needed to accomplish. The result was a more focused experience that made it easier to create, manage, discover, and share competitive insights.

The experience was built around a few key principles
I created role-based navigation to keep each user focused on what mattered to them, while shared design patterns maintained familiarity and consistency across the platform.
Features and actions were surfaced based on permissions, keeping the interface relevant and uncluttered. I also introduced clear collaboration points to make handoffs between roles feel seamless, while progressive disclosure helped reveal more complex information and actions only when needed.
The goal was to make a feature-rich platform feel approachable, giving each user the right tools and context without overwhelming them with everything at once.
Result
A web app designed to take the busywork out of social media competitive reporting. Instead of jumping between platforms, spreadsheets, and endless reports, the marketing team could bring their brand and competitor data into one place and see what was happening at a glance. By connecting directly to platforms like Instagram and YouTube through the Upfluence API, the experience transformed scattered data into real-time, visual insights. Less data wrangling, more time understanding what the numbers actually mean.
The result was a faster way to spot trends, compare performance, make smarter decisions, and get back to the creative work that actually moves the brand forward.
85% Reduction | 3x Faster | 40% Increase |
|---|---|---|
In time spent on competitive analysis (from 20 hours to 3 hours per week) | Report generation and distribution to report analysts | In competitive insights actionability due to real-time data visualization |


